




We have given your investor Dashboard a new look. This page explains what each card shows, how it is calculated, and where to find the things that moved.
Your investments, balances and returns have not changed. Only the way they are presented has.
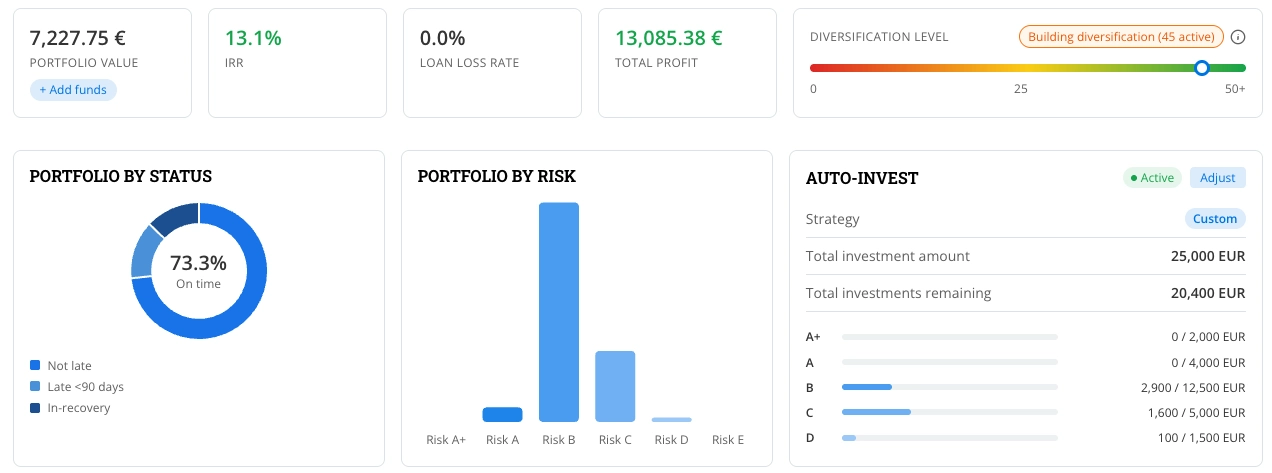
What is new at a glance
- A new responsive layout with cards and graphs.
- One IRR instead of two.
- New cards: Loan loss rate, Total profit, Diversification level, Portfolio by status, Portfolio by risk and Auto-invest.
- The loan list is no longer on the Dashboard. Find it in My loans.
- The Dashboard shows latest notifications under the graphs.
The top row
Portfolio value
The total of your remaining principal plus your wallet balance. Remaining principal is already reduced by any amounts we have written off. Use Add funds to top up your wallet.IRR
Your annualised return on the money you have invested. We now show a single IRR, calculated after losses: written-off amounts are deducted, so it reflects what you have actually earned.Previously the Dashboard showed two figures: IRR, and IRR "with provisions". Provisions were an accounting concept from the time we lent from our own balance sheet. They do not apply to the platform today, so we removed the second figure. Your displayed IRR may differ slightly from the one you were used to.
Loan loss rate
The share of your invested money that has been lost.Loan loss rate = written-off amounts ÷ total invested
A loan is only counted as lost once it has been written off, not while it is merely late or in recovery. This is why you can see late loans and still have a 0.0% loss rate. "Total invested" is cumulative: all the money you have invested over time, not only your currently active investments.
Total profit
The total interest you have earned, including late interest, minus written-off amounts.Total profit = interest + late interest − written-off amounts
Diversification level
A slider based on the number of active investments you hold. More investments spread across more borrowers means less dependence on any single loan.- Red (0–24 active investments): Poor diversification
- Orange (25–49): Building diversification
- Green (50+): Well diversified
The card shows your current count, for example "Building diversification (45 active)". The calculation assumes equal investment sizes in each loan; actual amounts are not taken into account.
Portfolio by status
A donut chart showing how your portfolio is split by repayment status. The big number is the share of your portfolio that is on time. Amounts are based on remaining principal.
| Segment | What it means |
|---|---|
| Not late | Loans with status "According to schedule" |
| Late <90 days | Loans that are 1–89 days late |
| In-recovery | Loans that are 90+ days late |
Hover over a segment to see the number of loans and the amount.
Portfolio by risk
A bar chart of your active investments by risk class, from A+ to E. Hover over a bar to see the number of loans and the share or amount of your portfolio in that class.
Auto-invest
A summary of your auto-invest strategy, with a button to adjust it.
- Status and strategy: whether it is active and which strategy you use.
- Total investment amount: your investment goal.
- Total investments remaining: how much of the goal is still to be invested.
- By risk class: how much has been invested out of the amount assigned to each class.
If auto-invest is switched off, this card invites you to set it up.
Cash flow graph
A forecast of the payments you expect from your active investments, by month and then by period (7–12 months, 13–24 months, 25+ months). Overdue amounts appear under "30+ days late".
The forecast is based on payment schedules. It is not reduced by partially received payments, and loans in collection are removed from it.
Where did my numbers go?
| Previously on the Dashboard page | Now |
|---|---|
| Remaining principal, Received principal, Received interest | Account statement page |
| List of loans with status | My loans |
| IRR with provisions | Removed. The single IRR replaces it. |
Frequently asked questions
Why did my IRR change?
We now show one IRR, calculated after losses. Small differences from the previous figure are expected.
Why is my Loan loss rate 0.0% when some loans are late?
Loss is only recognised when an amount is written off. Loans are written off once recovery efforts are exhausted. Late and in-recovery loans are not yet losses.
Did my investments or balance change?
No. Only the presentation changed.